If you want loyal customers who keep coming back, tracking the right customer satisfaction metrics is the only way to know what’s actually working — and what’s silently killing your business. Simply put, these metrics are the numbers that tell you how your customers feel, how likely they are to stay, and where your service is letting them down.
Let’s be honest. Most businesses collect feedback. Very few actually know what to do with it.
That’s what this guide fixes.
What Are Customer Satisfaction Metrics, Really?
Think about it this way. You wouldn’t drive cross-country without a speedometer, a fuel gauge, and a GPS. But that’s exactly what most businesses do — they drive forward with zero idea whether customers are happy, frustrated, or already walking out the door.
Customer satisfaction metrics are your dashboard.
Each one measures a different part of the customer experience. Some tell you how they felt right after a purchase. Others predict whether they’ll come back six months from now. Used together, they give you a complete, honest picture of your relationship with your customers.
Here is the thing — no single metric tells the whole story. That’s why smart businesses track several of them at once.
The 5 Most Important Customer Satisfaction Metrics
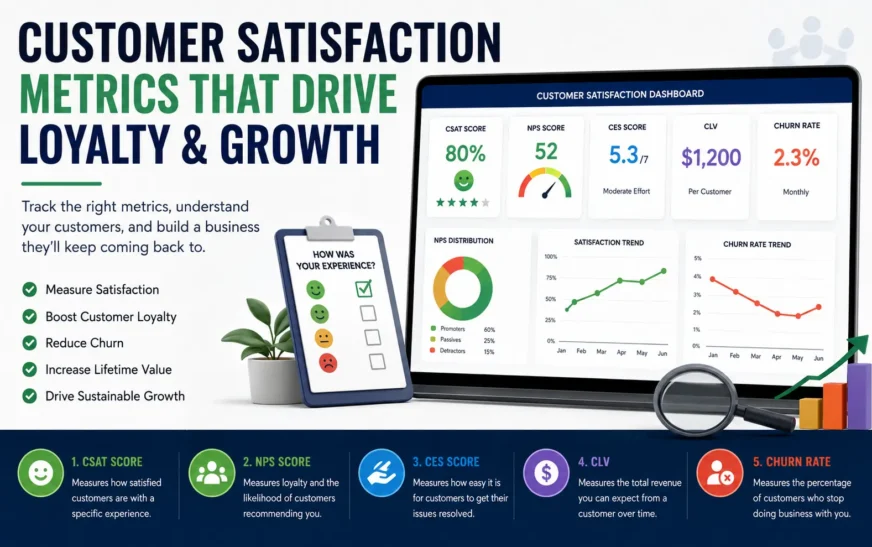
1. CSAT Score (Customer Satisfaction Score)
CSAT is the most direct metric you’ll find. After a purchase, a support call, or any interaction, you ask your customer one simple question:
“How satisfied were you with this experience?”
They answer on a scale — usually 1 to 5 or 1 to 10. You then take the percentage of customers who chose a positive score (typically 4 or 5) and that’s your CSAT.
Formula: (Satisfied Customers ÷ Total Respondents) × 100
For example, if 80 out of 100 customers rate you a 4 or 5, your CSAT is 80%.
So, what’s a good CSAT score? Industry benchmarks vary, but a score above 75–80% is generally considered strong. Anything below 60% is a red flag you shouldn’t ignore.
Best used for: Post-purchase surveys, support ticket resolutions, onboarding flows.
2. NPS — Net Promoter Score
NPS is the loyalty metric. It asks your customers one deceptively powerful question:
“How likely are you to recommend us to a friend or colleague?” (0–10)
Based on their answer, customers fall into three groups:
- Promoters (9–10): Your biggest fans. They refer people, defend your brand online, and stick around.
- Passives (7–8): Satisfied but not enthusiastic. They could leave if a competitor offers something better.
- Detractors (0–6): Unhappy customers who may actively warn others away from you.
Formula: % Promoters − % Detractors = NPS
An NPS above 50 is excellent. Above 70 is world-class. Apple, for reference, consistently scores in the 60s and 70s.
Personally, I consider NPS the single most important metric for long-term business health. Because if your customers wouldn’t recommend you, that’s the clearest signal possible that something needs to change.
3. CES — Customer Effort Score
This one surprises a lot of people.
CES doesn’t measure happiness. It measures ease. It asks:
“How easy was it to resolve your issue today?” (1–7 scale)
The idea behind CES is brilliant in its simplicity: customers don’t want to be delighted. They just want their problems solved without jumping through hoops. Research by the Corporate Executive Board found that reducing customer effort is more effective at building loyalty than going above and beyond in service.
A low CES (meaning high effort) is a direct predictor of customer churn.
Best used for: After support interactions, self-service portals, checkout processes.
4. CLV — Customer Lifetime Value
CLV shifts your thinking from “how do I close this sale?” to “how do I keep this customer for years?”
Formula: Average Purchase Value × Purchase Frequency × Customer Lifespan
For example, if a customer spends $100 per order, orders 4 times a year, and stays for 3 years, their CLV is $1,200.
Knowing your CLV tells you exactly how much you can afford to spend acquiring a new customer. If CLV is $1,200, spending $200 on ads to acquire one new customer is a very smart investment. But if your CLV is only $150? That same ad spend is a money pit.
As a result, CLV becomes your pricing, marketing, and retention strategy all rolled into one number.
5. Churn Rate
Churn rate tells you the percentage of customers who stopped doing business with you in a given period.
Formula: (Customers Lost in Period ÷ Customers at Start of Period) × 100
For SaaS businesses, a monthly churn rate under 2% is considered healthy. For e-commerce, anything above 5–7% annually deserves serious attention.
Here is the thing about churn — it’s a lagging indicator. By the time you see it in your data, the customer is already gone. That’s why you pair it with CES and NPS, which catch dissatisfaction before it becomes churn.
How to Use Customer Satisfaction Metrics Together
Tracking just one metric is like reading only one page of a book. You get a fragment of the story.
Here’s a real-world scenario to show you how these metrics work as a team:
Imagine you run a SaaS product.
- Your NPS drops from 52 to 38 this quarter.
- You dig into your CSAT data and see support satisfaction fell to 61%.
- Your CES scores show customers are rating issue resolution a 5 out of 7 — high effort.
- Your churn rate has climbed from 1.8% to 3.2% monthly.
See what happened there? NPS was the early warning. CSAT narrowed it to support. CES told you why — the resolution process was too painful. And churn rate confirmed the damage.
Without all four data points, you might have assumed it was a product problem and wasted months rebuilding features nobody asked for.
Common Mistakes Businesses Make With These Metrics
Mistake 1: Tracking metrics without acting on them. Collecting feedback and doing nothing with it is worse than not collecting it at all. Customers feel heard when you survey them. If nothing changes, that turns into frustration.
Mistake 2: Surveying too often. Survey fatigue is real. A customer who gets a feedback email after every interaction will start ignoring them — or worse, submitting random answers just to close the popup.
Mistake 3: Looking at averages only. An average NPS of 42 sounds okay. But if 30% of your customers are detractors in one specific region or product line, that average hides a serious problem. Always segment your data.
Mistake 4: Ignoring qualitative feedback. Numbers tell you what is happening. Comments and open-ended responses tell you why. The two work together.
Mistake 5: Confusing correlation with cause. Your CSAT score dropped the same week you launched a new feature. But was the feature the cause? Or was it a delayed shipping issue from the week before? Don’t jump to conclusions without digging into the timeline.
FAQs About Customer Satisfaction Metrics
Q1: What is the best customer satisfaction metric for a small business?
Start with CSAT — it’s easy to implement and gives you immediate, actionable feedback after every customer interaction. Once you’re consistently collecting CSAT data, add NPS to gauge long-term loyalty.
Q2: How often should I measure customer satisfaction?
For CSAT and CES, measure after every relevant interaction (support calls, purchases, onboarding). For NPS, a quarterly pulse survey gives you trend data without overwhelming your customers.
Q3: What’s a good CSAT score by industry?
Benchmarks vary: retail averages around 77–80%, software/SaaS around 74–78%, and banking around 76%. Aim to stay at or above your industry average and focus on consistent improvement.
Q4: Can customer satisfaction metrics predict business revenue?
Yes — and that’s the point. High NPS scores are strongly linked to organic growth through referrals. High CLV directly ties to revenue predictability. Businesses with top-quartile CSAT scores tend to outperform competitors financially over 3–5 year periods.
Q5: Is NPS still a reliable metric in 2025?
NPS has faced some criticism for being too simple, but it remains widely trusted because of its benchmarkability and predictive power. The key is to always follow up the score with an open-ended “why” question — that’s where the real insight lives.
Your Next Step
Customer satisfaction metrics aren’t just numbers on a spreadsheet. They’re the voice of your customers — translated into data you can actually use.
Start with one metric. Pick CSAT or NPS. Set up a simple survey, collect two to three months of data, and look for patterns. Then layer in CES and CLV as your process matures.
The businesses that win aren’t always the ones with the best product. They’re the ones that listen the hardest — and move the fastest on what they hear.